Knowing how to calculate your break-even point using a break-even point formula will serve you well, particularly during times of uncertainty. It enables you to gauge the profitability of your business and can help you make important decisions around your pricing strategies, inventory, operations and more.
Ultimately, calculating your break-even point allows you to have a better understanding of the financial health of your business, so you can keep your costs under control and ensure you’re making smart investments.
This blog walks you through the fundamentals of calculating your break-even point. It covers:
Let’s get started!
Put your store growth on autopilot
Did you know that merchants who use Lightspeed POS grow their business four times faster* than their competitors? Our system helps you automate tedious tasks, order, manage and sell inventory smarter, accept payments and scale your profits.
* Source:Lightspeed’s Year in Review
What is the break-even point?
Simply put, the break-even point is the amount of sales a business needs to generate in order to cover its total costs. At this point, you’re not making a profit, but you’re not losing money either. For retailers, learning how to calculate break even point helps determine how much you’ll need to sell to justify a new investment, such as launching a product line or opening a new location.
Break-even point formula
The following are commonly used formulas for performing a break-even analysis. The first is based on units, the second on sales dollars.
Understanding the break-even point formula
“A break-even analysis calculates how much income you need to cover your expenses,” explains Rob Stephens (CPA), founder of CFO Perspective—a financial management education company. “Break-even analysis provides a reality check for any investment you make in your business. These investments might be a new product or location.”
Retailers have to make many guesses when deciding whether to add a product line or open a location. But retailers rarely know how much new product they will sell or what sales will be at a new location. This is why it can be difficult to forecast sales and revenue.
“I’ve built many projections,” says Rob. “When I ask someone how much they’ll sell, they usually answer, ‘I don’t know’. That’s very true, but it’s not useful for making a decision.
“Break-even analysis simplifies the question, by figuring out the least sales needed to cover your expenses. It’s much easier to answer whether you can exceed the sales needed to break even, than it is to guess your future sales,” says Rob.
To gain a better understanding, let’s break down each component of the breakeven analysis formula.
Fixed costs
“Fixed costs are costs that don’t change whether you sell one unit or one thousand units. For example, if you’re opening a new location, then the cost of the building is a fixed cost,” says Rob. Other fixed costs include:
- Salaries
- Utility bills
- Loan repayments
- Equipment hire
- Lawyers
- Accountants
- and other advisory services.
Variable costs
Variable costs are those that change across different parts of the business year. For example, a retail business might spend more on promotional advertising and casual staffing in the weeks leading up to Black Friday – the point in the year where many retailers aim to break even.
Here’s a chart that can help you differentiate between fixed and variable costs:
| Fixed costs | Variable costs |
| Rent | Raw materials |
| Taxes/Insurance | Utilities |
| Salaries/Wages | Production/Packing supplies |
Contribution margin
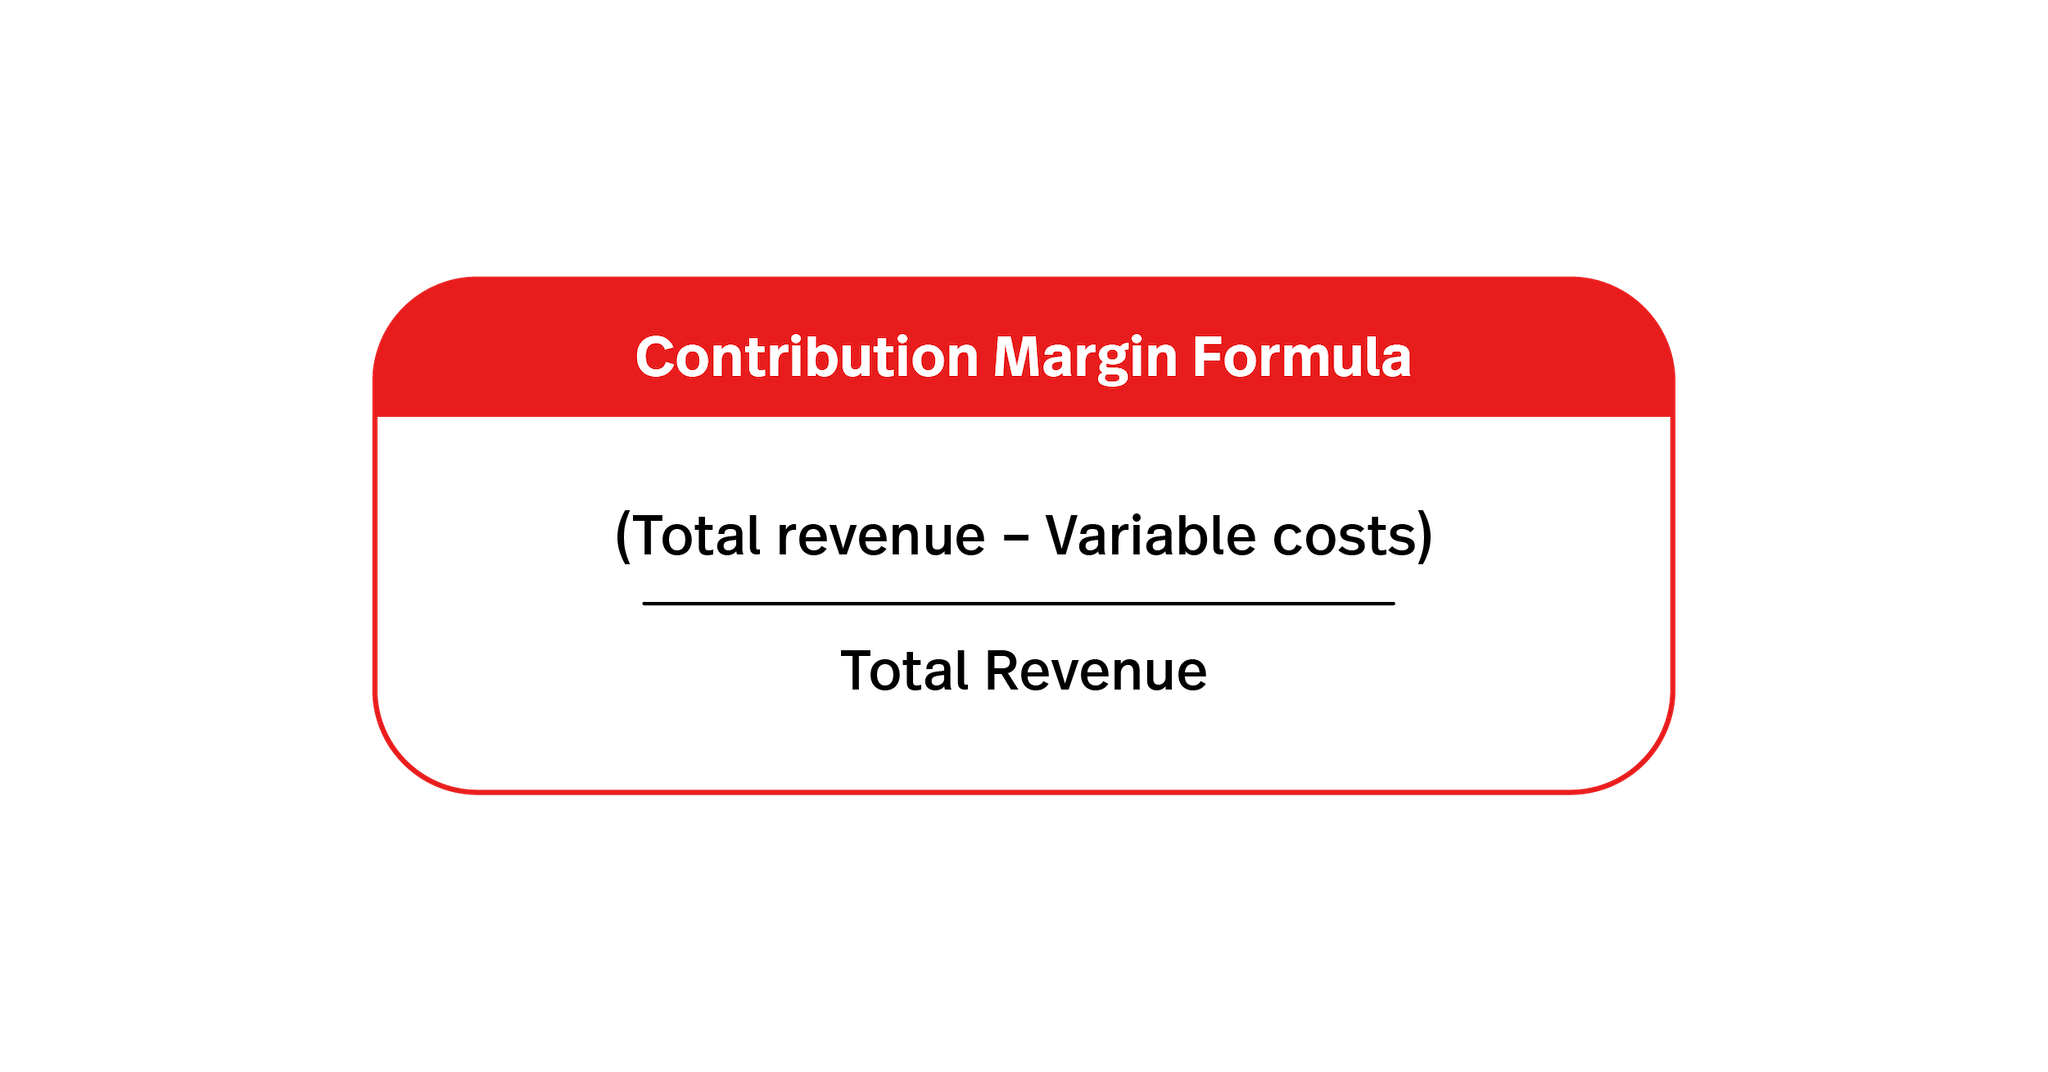
Investopedia explains the contribution margin as the difference between the sale price of a product and the variable costs associated with its production and sales process. When calculating your break-even point, this needs to be expressed as a fraction of total revenue.
As a simple formula, it looks like this:
Contribution margin = (Total revenue – Variable costs) / Total Revenue
Break-even point examples
Now that we covered the basics of calculating your break-even point, let’s look at these formulas in action.
Calculating your break-even point in units
The first break-even formula shows you the number of units you need to sell to break even on a product. The formula is:
Break-Even Point (Units) = Total Fixed Costs / (Price per Unit – Variable Cost per Unit)
Let’s say you’re considering adding a new line of designer handbags and want to figure out how many you need to sell to break even. Here’s how the math works:
Fixed costs = $10,000
Variable cost per bag = $100
Price per bag = $500
Break-even point = $10,000 / ($500 – $100) = 25
You’ll need to sell 25 bags to break even on your investment.
Calculating your break-even point in sales dollars
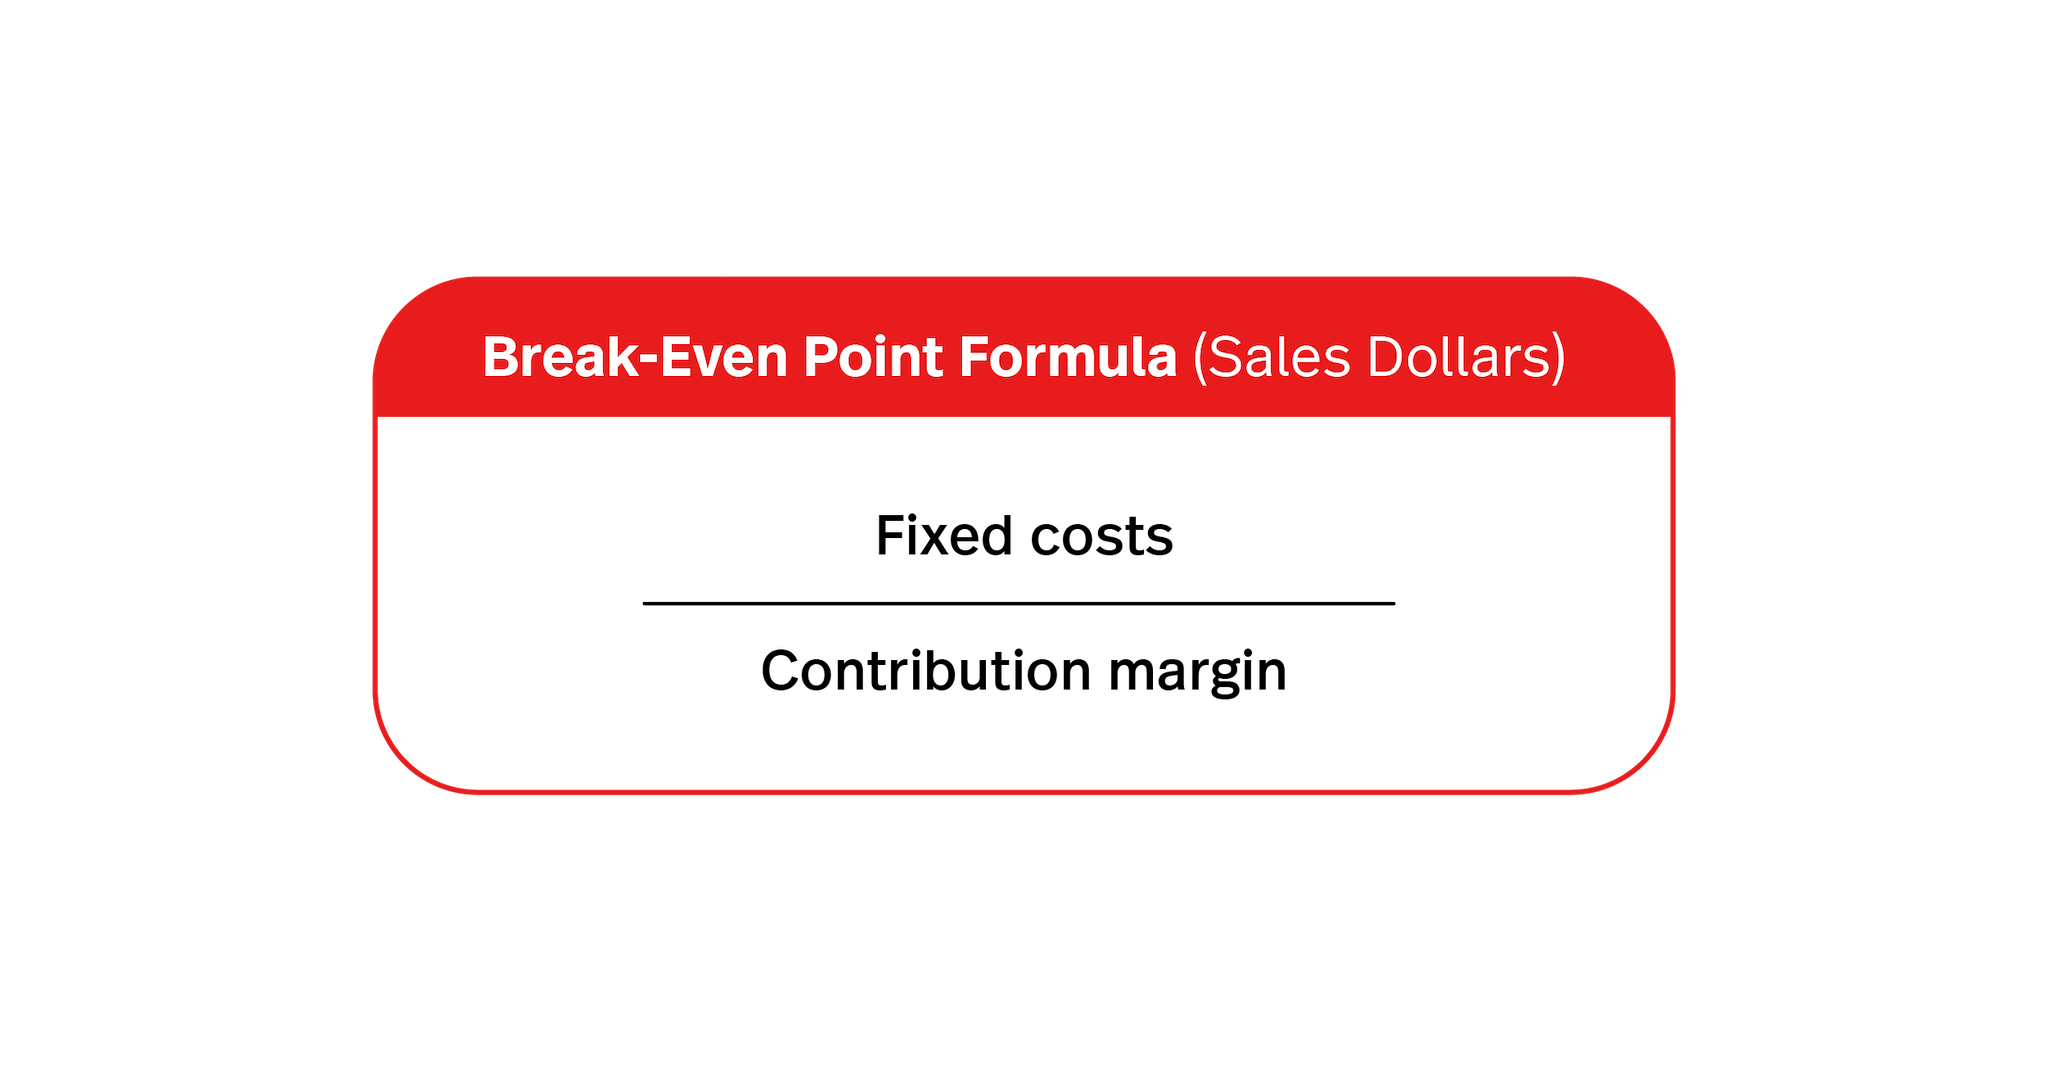
The next formula shows your break-even point in sales dollars. It tells you how much revenue you need to make before breaking even. The equation is:
Break-Even Point (Sales Dollars) = Total Fixed Costs / Contribution Margin Ratio
Using the same handbag example:
Fixed costs = $10,000
Contribution margin ratio = 0.8
Break-even point = $10,000 / 0.8 = $12,500
You’ll need to bring in $12,500 in sales revenue from the handbags to cover your costs and reach the break-even point.
Why is a break-even point formula useful for retailers?
“A break-even analysis is most useful for a new product or changing the price of an existing product,” explains Rob. “For example, how many more units would you need to sell with no decrease in total profit if you cut your price by 10 percent?”
Break-even analyses are also important for managing financial risk, as Brian Cairns, CEO of ProStrategix Consulting, explains.
“Your financial risk goes up the closer you are to your break-even point. If you are less than 10 percent above your break-even point, then it would only take a minor increase in costs to fall below. If you are around 30-40 percent above break even, then you have a lot more room to maneuver.”
Here’s an overview of what a breakeven analysis can be used for:
- Launching new products: Helps assess if expected sales will cover costs before investing in a new item
- Pricing strategy: Guides pricing to balance competitiveness and profitability
- Cost control: Highlights fixed and variable costs, making it easier to spot and reduce unnecessary expenses
- Profit planning: Shows how many units you need to sell to hit specific profit goals
- Scaling decisions: Helps evaluate if expanding a product line or entering a new market is financially viable
- Supplier negotiation: Clarifies variable costs, supporting better deals with vendors
Three times retailers might do a break-even analysis
Break-even analyses are beneficial when setting prices, evaluating a fixed cost change or purchasing equipment. Break-even analyses can also help assess your commercial rent or hiring needs. And they are useful when you are:
- Starting a business: Performing a break-even analysis can be challenging when starting up, because you don’t yet have a track record of business data. Still, doing a break-even analysis (using industry or public competitor data) can help inform financial planning.
- Launching a new product: A break-even analysis can help you figure out how to price a new product and what impact that price may have on other products in your line.
- Exploring new sales channels: A break-even analysis can also help recalculate changed expenses, especially given many retail businesses are now pivoting to a greater focus on online selling.
The limitations of a break-even analysis
As useful as they are, break-even analyses have their drawbacks.
“It can be difficult to estimate marginal costs accurately. For example, utilities can be variable, but how do you appropriately allocate utility use to a given unit? It’s very difficult,” says Brian.
“Therefore, many people use an average across the year, and while that can be a good proxy, it breaks down if you have any significant seasonality. This is why a break-even analysis is helpful for knowing, directionally, where you should be. It’s always wise to err on the side of being significantly above your break-even point.”
Product variety
“Break-even analysis isn’t as effective when analyzing a mix of products,” adds Rob. “The break-even sales amounts vary, with the variance in the margins between the products.
“The simple break-even formula assumes your sales price and costs remain stable. In real life, your variable costs change as the amount of units changes. For example, you may get a volume discount with larger inventory purchases.”
Price cannibalization
“The biggest mistake I see people make with break-even analysis is ignoring cannibalization,” says Rob.
Price cannibalization is when one product decreases sales of another product. For example, selling a new model will greatly reduce the sales of the old model. Think of the iPhone, for example.
“Price cannibalization is reducing your price to existing customers instead of selling to them at your old price, Rob says. “Let’s say you usually sell your product at $100, but you lower the price to $90 to drive growth. If you normally sell 1,000 units, your profit dropped $10,000 — ($100-$90=$10 X 1,000) — which has to be covered by the profits from selling more units at the reduced price.”
How to lower your break-even point
There are two ways to lower the break-even cost: either lower your fixed costs or increase your margin.
“The most effective way to reduce the sales you need to break even is to reduce your fixed costs. For example, you can rent a new location instead of buying it,” says Rob.
To lower break-even points, retailers can also:
- Increase the prices of the goods
- Talk to landlords about lowering rents
- Work out lease terms linked to sales volumes
- Reassess opening hours and cap employee shifts
- Reduce your fixed costs by converting them into variable costs
- Buy smaller quantities to reduce the fixed cost of a large initial order
Final words
If you’re running a for-profit business, your break-even point should always be top of mind. To ensure you calculate it correctly, it’s important to keep an eye on retail metrics like your sales and expenses. Lightspeed’s reporting capabilities makes it easy to collect these figures so you can conduct an accurate analysis of your financial performance.
See these reporting features in action by watching a demo of Lightspeed today.